As a marketer of many years, I always advise my students and clients to embark on a marketing research exercise before launching a new product. It never ceases to amaze me how many large organisations fail to initiate such a process then wonder why the launch flops. The European Super League is an example of one of these mistakes. This blog will demonstrate how, through the use of Netnography, one can very quickly evaluate the perceptions of the said market.
Before explaining the details, it’s worth spending a bit of time outlining the concept of Netnography. It is an adapted ethnographic approach that uses archival and real-time data from all internet-enabled technologies. The process can be quantitative or qualitative. It can also be passive (where there are no engagements with participants) or active (where researchers would interact with participants).
The example I want to share is passive a Netnographic one that uses NodeXL (see www.smrfoundation.org ) as the application programming interface (API: the link that allows you to draw down data from your chosen platform of research). My chosen platform was Twitter because many of the media companies use it to engage and update their followers. Three keywords were selected for review: ‘EuropeanSuperLeague’, ‘SuperLeague’ and ‘Super League’. In the twenty-four-hour period from the initial launch of the European Super League, 13,965 Tweets were written, which generated 9,239,161 ‘Likes’ and 1,591,724 Retweets. The overwhelming sentiment was one anger and/or sadness. The Tweet that generated the most ‘likes’ (343,042) and Retweets (74,359) was:
“Kids grow up dreaming to win the World Cup and the Champions League – not any Super League. The enjoyment of big games is that they only happen once or twice a year, not every week. Really hard to understand for all football fans out there…⚽💔”
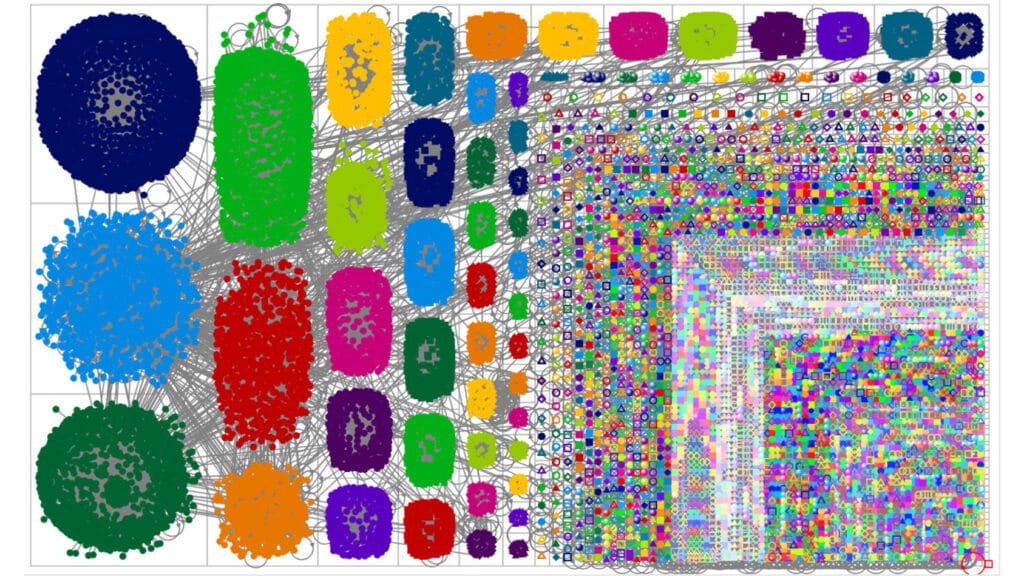
The data can be presented visually using the concepts associated with social network analysis. Figure 1 is an example of this, it illustrates the many conversing networks utilising the keywords highlighted above.

Figure 1 – An analysis of the networks generated
Interestingly, out of the six English clubs in the Super League, only Arsenal, Chelsea, Liverpool and Spurs announced their intention to move to this new format on Twitter. After that none of them engaged with users on the subject or provided further updates. One would normally expect a continuing fanfare of information, exulting the virtues of the new product. As it stands the English clubs have now all distances themselves from the European Super League, but the damage to their reputations has already been done
The example above demonstrates that Netnography is a research method that can yield vast quantities of data very quickly. I will be spending more time in the future going through this in more detail.
Alan Shaw
Latest posts by Alan Shaw (see all)
- What is social listening and why it is an important tool for researchers? - July 31, 2021
- COVID-19 and Remote Learning: Experiences of parents supporting children with SEND during the pandemic. - June 30, 2021
- Using Netnography To Evaluate The Launch And Collapse Of The European Super League - April 21, 2021
- Developing Semi-Structured Interview Questions: An Inductive Approach. - April 9, 2020
- Developing Semi-Structured Interview Questions: A Deductive Approach - April 9, 2020